 Known as one of the most reliable and accurate weather services in Australia, the Bureau of Meteorology (BOM) has teamed up with Queensland’s Powerlink in an ‘industry-first partnership†to improve its energy network and deliver near real-time solar irradiation information.
As explained by Powerlink’s chief executive Paul Simshauser, “this partnership will give Powerlink insights into weather data, models and forecast trends that help us plan the future transmission network.â€Â
“Energy demand and our ability to deliver safe, reliable and cost-effective electricity supply to close to five million Queenslanders is closely linked to weather conditions and impacts.â€Â
In a three-year commitment, the partnership aims to enhance predictions, curb impacts and improve decision making regarding domestic solar PV modules and large-scale solar arrays across the QLD network.
Queensland & Renewable Energy
The BOM-Powerlink partnership follows the QLD Government’s announcement for $145 million to be set aside for renewable energy zones in north, central and south-west Queensland.
According to Green Energy Markets (GEM) over 108 large-scale renewable energy projects are currently in the development pipeline for the state.
With this influx of renewable and solar generated power, it is now crucial to develop transmission and grid stability strategies.
According to BOM’s chief executive, Dr. Andrew Johnson, “Weather and climate conditions are increasingly connected to the secure, safe and efficient operation of the energy grid, and this is never more evident than when it comes to the energy transmission network.â€Â
“This partnership will draw on the bureau’s expertise to drive solutions in priority areas to ensure the safe and reliable day-to-day operation of Powerlink’s network.â€Â
Solar Energy & Solar Irradiation
Known for our clear blue skies and harsh sunlight it is no wonder that Australia has one of the best climates for the capture of solar energy.
In Australia we receive on average 58 million PJ of solar irradiation per year, that’s approximately 10,000 more than our total energy consumption needs.
Australia, however, only uses around 0.1 per cent of solar energy for its total energy consumption needs. That’s a whole load of sunlight just waiting to be utilised for free!
Below is a table of the average sunlight hours and solar irradiation produced across Australia.
|
Average peak sunlight hours & solar irradiation across Australia’s states |
||||||
| VIC | ACT | NSW | WA | NT | QLD | |
| Average Sunlight Hours | 4.6 | 4.9 | 5.1 | 5.3 | 5.8 | 5.4 |
| Annual Solar Irradiation (kWh/m2/ year) | 1679 | 1789 | 1862 | 1935 | 2117 | 1971 |
Once developed, Powerlink’s display of real-time solar irradiation will allow major networks to manage and optimize on the Australian sunshine per minute, hour, day and year.
What Does This Mean For Residential Solar Owners?
By knowing the specifics of the solar irradiation in your location you can better utilise your solar energy.
For example, if the solar irradiation for the day indicates its at its highest at around 1 pm ensure to use your energy at this time.
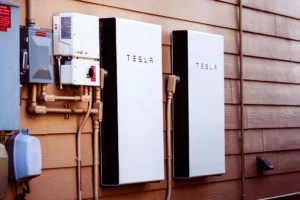
Set your washing machine, dishwasher and drier for this time and save any extra solar energy in your solar battery for later use.
Solar Panels For Your Home
Interested in how you can use solar to power your home? Solar Market connects you with three complimentary quotes from CEC accredited solar installers in your area. Get the right information, quotes and advice so you can start your renewable journey the right way!
